Showing posts with label mastercharts. Show all posts

Wednesday, 18 May 2016

Mastercharts EURUSD - forex broker for news trading

Mastercharts EURUSD ~ forex broker for news trading


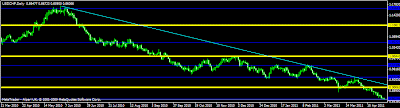
The major support/resistance areas for EURUSD are situated on the yellow lines and the blue/red lines are the minor areas. Here are the levels.


1.60500
1.52000
1.41000
1.16600
1.07100
0.83300
More info for Mastercharts EURUSD ~ forex broker for news trading:

Monday, 16 May 2016

Mastercharts AUDJPY - forex news for trading

Mastercharts AUDJPY ~ forex news for trading


This is a pair I dont trade regularly except there is an irresistible opportunity. I however post it for the benefit of traders trading this pair.

The major support/resistance areas for AUDJPY are indictated on the yellow lines and the blue/red lines are the minor areas. The distance between each area are roughly 1000 pips each.

As usual the monthly week, and daily charts are attached.
More info for Mastercharts AUDJPY ~ forex news for trading:

Wednesday, 27 April 2016

Mastercharts EURUSD Monthly and weekly charts - forex fundamental news trading

Mastercharts EURUSD Monthly and weekly charts ~ forex fundamental news trading


More info for Mastercharts EURUSD Monthly and weekly charts ~ forex fundamental news trading:

Saturday, 23 April 2016

Mastercharts USDCHF - forex market fundamental news

Mastercharts USDCHF ~ forex market fundamental news


This is another pair I dont trade regularly. However, I did technical analysis on the pair for a reader on this forum. After the analysis, I decided to prepare a mastercharts for for the benefit of benefit of those who might be interested in this currency pair.

The major support/resistance areas for USDCHF are indictated on the yellow lines and the blue/red lines are the minor areas. They are located roughly 1000 pips apart.

As usual the monthly week, and daily charts are attached.

By the way, did you see the fall on the major pairs over the last few days? GBPUSD fell by about 400 pips from the highest point so far this weej. Check the mastercharts for these pairs in the previous post and you will see how a break of the major support/resistance precipates a rush to the next level.

Enjoy your trades.
More info for Mastercharts USDCHF ~ forex market fundamental news:

Tuesday, 5 April 2016

Mastercharts GBPCHF - forex factory trading news

Mastercharts GBPCHF ~ forex factory trading news


This is another pair I dont trade regularly. However, I did technical analysis on the pair for a reader on this forum. After the analysis, I decided to prepare a mastercharts for for the benefit of benefit of those who might be interested in this currency pair.

The major support/resistance areas for GBPCHF are indictated on the yellow lines and the blue/red lines are the minor areas.

As usual the monthly week, and daily charts are attached.


My intention is to post Mastercharts for about a dozen pairs after which I will explain how to:

a) Update the charts
b) Use the charts for long-term trading
c) Use the charts for short-term trading
d) How to use the chart for day-trading
More info for Mastercharts GBPCHF ~ forex factory trading news:

Saturday, 2 April 2016

How to use mastercharts - forex trading financial news

How to use mastercharts ~ forex trading financial news


I will use the GBPUSD to explain the usage of the charts. You will have observed that GBPUSD is my favourable pair followed by GBPJPY. GBPUSD is more rational, predictable and logical while GBPJPY on the hand is perhaps one of the most irrational and volatile currency pair in the world. If you read some of my previous posts you will have a better insight into the character of some of these pairs.


How to use the Mastercharts

Trading requires careful preparation and insightful analysis. This could be overwhelming and confusing to majority of traders. The truth of the matter is that most traders are incapable of undertaking the complex technical analysis required for informed decisions. The fundamental analysis is a different challenge entirely. I read somewhere that you need 100,000 hours of study to fully understand forex trading. Let me tell you the truth, this statement though slightly exaggerated might not be very far from the truth. However, as a result of my researches over the last few years, I have narrowed down this complex endeavour into some simple easy to understand strategy. The secrets of forex price action are in the higher timeframes. The first step in this process is to prepare the chart for any currency pair you wish to trade to be trader-friendly. How do you make your charts trader-friendly?


How to create a user-friendly chart


If you read my post on how trading could be colourful you will have a clear insight on how to achieve this. As a recap, here are the steps to make your charts user-friendly:

a) Open a new chart for the currency you wish to trade (GBPUSD in this example)
b) Go to the weekly timeframe and draw horizontal lines at the level indicated in my mastercharts. The major levels for GBPUSD are:

a. 1.73000
b. 1.63000
c. 1.53000
d. 1.43000
e. 1.33000
f. 1.23000

c) Insert Relative Strength index (RSI) for 14 days period.
d) Go to the daily timeframe and identify the historical high and low points on the RSI
e) Draw horizontal lines on the daily RSI depicting the historical high and low points.
f) Go to the weekly time frame and click on insert shapes and draw rectangular shape between the highest horizontal line on the RSI and 70 point level. Do the same thing for the lowest point and the 30 point level.
g) Select the rectangular shape above 70 point level and change the colour to yellow. You can select by double clicking on the shape first, then right click and pick rectangular properties and pick the colour from style.
h) Select the rectangular shapes below 30 point level and change the colour to red.


If you follow the above steps, your chart will look like the chart for my example. Your chart is now trader-friendly and you are ready to roll.
More info for How to use mastercharts ~ forex trading financial news:

Tuesday, 29 March 2016

GBPUSD trading opportunities - forex market news feed

GBPUSD trading opportunities ~ forex market news feed


In the past few weeks, we have discussed the mastercharts for major pairs. Beginning from this week we shall begin to examine the interpretation of some of these charts beginning with GBPUSD which is the major pair I trade regularly.

As I have mentioned in some of my previous posts, if you want to be a successful trader, it is always advisable to concentrate on one or two pairs first. Trading this way, you will develop the ability to understand the key support/resitance areas, trend and price action for the pairs. By the time you understand a pair, it is alway easier to make profit consistently from your trades. In fact, you do not need to trade more two or three pairs to be a successful trader. Timing is very critical in this endeavour and the important ones are:


TIME TO WAIT
TIME TO BUY
TIME TO SELL
TIME TO TAKE PROFIF


GBPUSD closed around 1.61900 last week. Both the daily and H4 charts closed below the long-term bullish trendline from April 2010. The weekly needs to close below this trendline and 1.60000 to finally confirm that the bear has taken over.

Short Term Trades

Here are the targets for short trades:

1st support - 1.61000
2nd support - 1.60000
3rd support - 1.59350
4th supprt - 1.58000
5th support - 1.55000
6th support - 1.53000


Here are the targets for long trades:

1st resistance - 1.63000
2nd Resistance - 1.64000
3rd Resistance - 1.65500
4th Resistance - 1.67500
5th Reistance - 1.70000

The most important support/resistance levels for this week is the first and second resistance/support levels.

From where the price open this week, we have roughly 200 pips either way for this week. You will still need H4 to confirm immediate support/resistance and M15 for the best entry point. Please include RSI 14 days period with horizontal line at 50 point marks in your chart to confirm this support and resistance level on any time zone.

Long Term Trades

Here are the available targets for short trades:

1st support - 1.60000
2nd support - 1.53000


Here are the targets for long trades:

1st resistance - 1.63000
2nd Reistance - 1.70000

For long-term trades if weekly fails to break 1.60000, then a long will be a good trade and if the weekly fails to break 1.70000, a short will be a good trade. Both trades should be good for between 300-500 pips and will require between 3-5 weeks for it to play out.

I attach the weekly, daily and H4 charts in support of the above analysis.
More info for GBPUSD trading opportunities ~ forex market news feed:

Saturday, 26 March 2016

Mastercharts for major pairs - news trading strategy forex factory

Mastercharts for major pairs ~ news trading strategy forex factory


What I will share you over the next few weeks is the outcome of some of the research efforts I have concluded. I call these charts the mastercharts. The yellow lines are the major support/resistance area, while the blue/red lines are for minor support/resistance


Replicate the levels on the chart on your trading platform. They are good enough to guide to a profitable trading you for a long time to come.


I share these charts here for the benefit of the lucky few who will be disciplined enough to exploit their usefulness.


The charts are for monthly, weekly, daily, H4 timeframe charts for the majors pairs.


Have a good day!
More info for Mastercharts for major pairs ~ news trading strategy forex factory:

Using mastercharts for day trading - .forex market news for today

Using mastercharts for day trading ~ .forex market news for today


We shall now discuss how to use the Mastercharts for:

a) Day Trading: Multiple trades targeting less than 10-50 pips at a time. Such trades should not be carried overnight, unless it is at BPE


b) Short term trading: Trades targeting 50-100 pips that could run for more than a day


c) Medium Term Trading: Trades targeting 100-200 pips that could run for 1-2 weeks


d) Long Term trading: Trades that could run upward to four weeks or more (1,500 pips and above)


Day Trading:

For day trading you need to take the following steps:

a) Draw additional horizontal lines every 50 or 25 pips on your chart
b) Use the H4 time frames to pick your trading opportunities
c) Your buy signal is given when the RSI on H4 timeframe enters the Red box and the sell signal when it enters the Yellow box
d) To enter a trade, go to M15 time frame and buy when both RSI on H4 and M15 enter the Red box and the sell signal when H4 and M15 enters the Yellow box
e) RSI 50 point level is where to take your profit or lock your trade (10-50 pips) per trade is adequate for this strategy.

See the daily H4 and M15 charts for daytrading. The sell signal zone on the charts are shown aqua boxes and the buy zones by blue boxes on the M15 chart.


short term Trading:
For the short term trading take the following steps:

a) Use the Daily time frame to pick your trading opportunities
b) Your buy signal is given when the RSI on Daily timeframe enters the Red box and the sell signal when it enters the Yellow box
c) To enter a trade, go to H4 time frame and buy when both RSI on Daily and H4 enter the Red box and the sell signal when Daily and H4 enter the Yellow box
d) RSI 50 point level is where to take your profit or lock your trade (100 pips and above per trade is ideal for this strategy.

See the Daily and H4 charts for short-term trading. The sell signal zone on the charts are shown by the aqua boxes and the buy zones by blue boxes on H4 chart.

Medium term Trading:
For Medium-Term take the following steps:

a) Use the Weekly time frame to pick your trading opportunities
b) Your buy signal is given when the RSI on weekly timeframe enters the Red zone and the sell signal when it enters the Yellow zone
c) To enter a trade, go daily time frame and buy when both RSI on Weekly and daily timeframe enter the Red box and the sell signal when Daily and weekly enter the Yellow box.
d) RSI 50 point level is where to take your profit or lock your trade (500 pips and above per trade (1500 pips most times).

See the Weekly and Daily for medium-term trading. The sell/buy zones on the charts are shown by the red circles on the daily chart


Long term Trading:
For Long-Term take the following steps:

a) Use the monthly time frame to pick your trading opportunities
b) Your buy signal is given when the RSI on monthly timeframe enters the Red box and the sell signal when it enters the Yellow box
c) To enter a trade, go to the monthly time frame and buy when both RSI on monthly and weekly timeframe enter the Red box and the sell signal when monthly and weekly RSI enter the Yellow zone. Historical analysis over the years have shown that you can begin to short if there is a reversal candle on the weekly when RSI touches 64-65 on the monthly. You can go down to the daily chart to get the best entry opportunities.
d) RSI 50 point level is where to take your profit or lock your trade (1000-3000 pips).

See the Weekly and monthly and weekly charts for long-term trading. The sell/buy zones are shown by the red boxes on the weekly charts. As you can see such opportunities rare. Personally I have not started trading at that level.


See the Weekly and monthly and weekly charts for long-term trading. The sell/buy zones are shown by the red circles on the weekly charts. As you can see such opportunities very rare. Personally I have not started trading at that level.
More info for Using mastercharts for day trading ~ .forex market news for today:

Tuesday, 22 March 2016

mastercharts USDCAD - free forex news trading software

mastercharts USDCAD ~ free forex news trading software


Let me continue my series of mastercharts for some of the major pairs with USDCAD.

The major support/resistance areas for USDCAD are situated on the yellow lines and the blue/red lines are the minor areas. The distance between each area are roughly 1000 pips each.

As usual the monthly week, and daily charts are attached.
More info for mastercharts USDCAD ~ free forex news trading software:

Monday, 21 March 2016

Mastercharts GBPUSD - forex strategies for news trading

Mastercharts GBPUSD ~ forex strategies for news trading


The major support/resistanc areas for GBPUSD are situated around every 1000 PIPS. Here are the levels.


1.93000
1.83000
1.73000
1.63000
1.53000
1.43000

1.60000 is a major psychological level, the gateway to the top and bottom for both bear and bull. The monthly, weekly and daily charts are attached
More info for Mastercharts GBPUSD ~ forex strategies for news trading:
 

Download Forex Robot Copyright © 2016 -- Powered by Blogger